

Vortex flow meter low flow accuracy depends on both the physical signal and the calibrated operating range. A visible reading alone proves neither. This guide explains how to investigate the problem and decide whether to adjust the installation, resize the meter, or change measurement technology.
Start with the specifications for your exact vortex flow meter, including its measuring bore, firmware options, fluid conditions, and required accuracy.
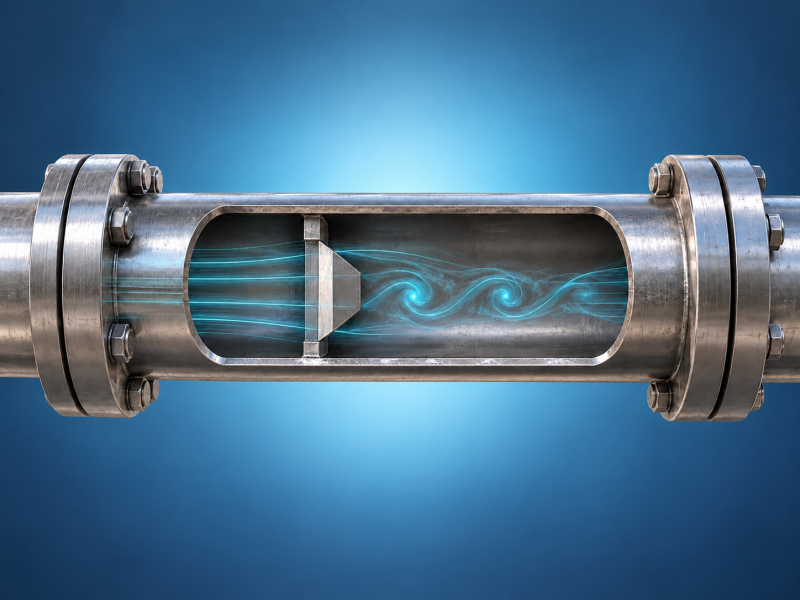
Why Accuracy Falls as Flow Decreases
Fluid passing a bluff body creates alternating vortices. Within the calibrated operating region, their frequency tracks volumetric flow. The transmitter converts that frequency using a K-factor, usually expressed as pulses per unit volume. FlowT explains this relationship in its vortex flowmeter working principle guide.
At low velocity, vortex pressure fluctuations weaken. Mechanical vibration and pulsation can then interfere with detection. Separately, decreasing Reynolds number can change the relationship between frequency and volume, creating error even when the instrument still detects a stable signal.
For a circular measuring bore, Re = ρvD / μ, where ρ is operating density, v is average velocity, D is internal diameter, and μ is dynamic viscosity. Lower velocity or higher viscosity reduces Reynolds number. Use fluid properties at operating temperature.
Density also affects signal strength: at comparable velocity, a lower-density gas produces a weaker vortex signal. At fixed mass flow, however, density changes velocity too. Evaluate the complete operating condition rather than assuming that lower pressure always means weaker detection.
Identify the Three Different Low-Flow Boundaries
- Minimum measurable flow: the sensor and electronics can detect a usable signal under specified conditions.
- Lower accuracy boundary: the stated measurement uncertainty applies above this point, subject to the other specifications.
- Low-flow cutoff: a configured threshold suppresses low readings, often to reject noise.
A model-specific example shows why the distinction matters. The November 2024 Rosemount 8800D product data sheet lists ±0.65% of rate for liquids above Re 20,000 and ±1% for gas and steam above Re 15,000, with configuration exceptions. It also specifies larger errors at lower Reynolds numbers down to 5,000. Those values describe that product and revision, rather than universal vortex limits.
For preliminary screening, convert the signal limit, required-accuracy limit, and cutoff to the same flow basis at the same conditions, then use the highest applicable threshold. If hypothetical limits are 3, 5, and 4 m³/h respectively, the lower boundary for the required accuracy is 5 m³/h. Lowering the cutoff does not change it.
A quoted turndown ratio needs the same scrutiny: ask which fluid, pressure, bore, and accuracy define its endpoints. The flow measurement sizing and selection guide provides broader selection context.
Also read the accuracy formula. At 4 m³/h, a hypothetical ±0.5% of reading means ±0.02 m³/h. A hypothetical ±0.5% of a 100 m³/h full scale means ±0.5 m³/h, or 12.5% of the actual flow. Neither specification can be extended below its stated operating range. Include additional low-flow terms when comparing candidates.
Match the Symptom to the Next Check
| Symptom | Useful check | Interpretation and action |
|---|---|---|
| Zero reading while flow continues | Compare independent flow estimate, cutoff, and physical limits. | Review settings only if flow is within the supported range. Otherwise investigate sizing. |
| Reading jumps as demand falls | Trend vortex frequency, diagnostics, and pump or valve activity. | Investigate noise or genuine pulsation before increasing damping. |
| Nonzero reading with confirmed no flow | Observe diagnostics and nearby vibration. | Investigate interference, sensor condition, and leakage before changing thresholds. |
| Stable reading disagrees with reference | Check units, fluid compensation, K-factor, and accuracy range. | A stable signal can still carry systematic error. |
| Local display agrees with reference; PLC does not | Compare mapped variable, raw output, and PLC scaling. | Correct the output chain before recalibrating the sensor. |
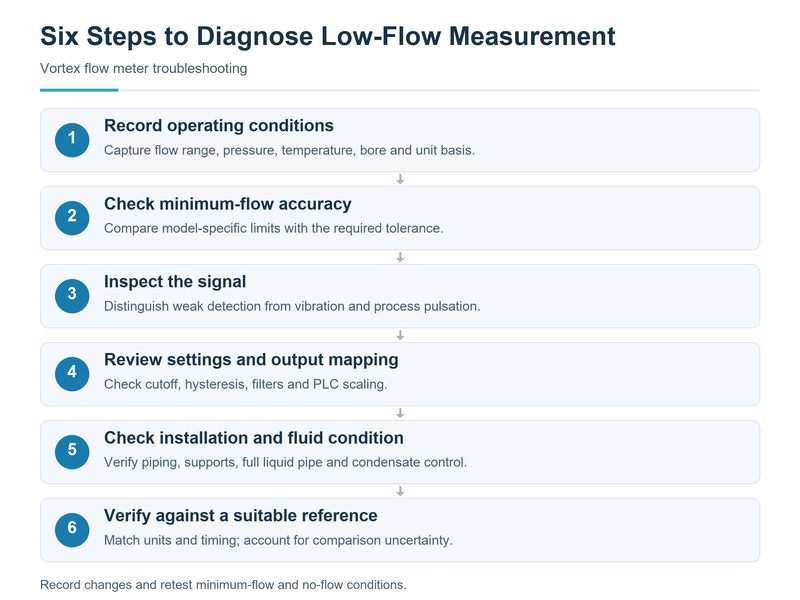
Six Steps to Diagnose Low-Flow Measurement
1. Record the Actual Operating Envelope
Collect minimum, normal, and peak flow, pressure, temperature, fluid composition, and measuring bore. Include startup and seasonal conditions. Historical design capacity alone can conceal an oversized meter operating near its lower boundary.
Check whether gas readings are actual m³/h, normalized volume, or kg/h. Record the reference pressure and temperature for normalized units. Compare operating volumetric flow with volumetric sizing limits only after conversion.
2. Obtain an Accuracy Result at Minimum Flow
Find the manufacturer's measurable-flow tables, accuracy notes, density or velocity restrictions, and applicable Reynolds limits. Request a sizing report if the brochure supplies only a headline accuracy and rangeability ratio.
The report should state specified accuracy and calculated pressure loss at your minimum, normal, and maximum conditions. If minimum flow falls outside the supported accuracy range, document that limitation before adjusting electronics.
In a hypothetical comparison, a specified ±2% accuracy tolerance at minimum flow may satisfy a monitoring requirement allowing ±3%, while failing a tighter control requirement. Define the acceptance criterion before declaring the installation satisfactory. Account separately for errors introduced by density compensation and the output chain.
3. Separate Weak Detection from Disturbance
At several steady operating points, record the available raw vortex frequency, signal-strength diagnostic, alarms, and reference flow. Within the calibrated region, frequency should broadly follow actual volumetric flow.
A frequency that disappears reproducibly below a particular flow suggests a detection boundary. A frequency that follows machinery activity while independently verified flow stays steady suggests interference. Neither pattern alone confirms the cause. Use the available diagnostics and inspection procedure for that model.
4. Review Cutoff, Filtering, and Output Mapping
Save the original configuration and change one parameter at a time. Retest both the lowest operating flow and confirmed no-flow conditions. A lower cutoff that also creates false flow has not solved the problem.
Check whether the selected model uses cutoff hysteresis: the flow needed to restart its indication may differ from the point where the reading disappeared. Record decreasing-flow and increasing-flow tests separately. Follow site isolation procedures when establishing no flow or inspecting pressurized equipment.
The Rosemount 8800D Modbus reference manual defines signal strength as the signal-to-trigger ratio and specifies a value above 4 for accurate measurement. Apply that threshold only to the model and diagnostic definition described. Increased damping smooths the indication but cannot restore an absent vortex signal.
For a linear 4–20 mA output configured as 0–100 m³/h, 4.64 mA represents 4 m³/h: Q = (I − 4) × 100 / 16. If the measured current is correct but the PLC displays another value, check its scaling and selected variable.
5. Inspect the Installation and Fluid Condition
Compare the installation with the model manual: upstream disturbances, required straight runs, gasket alignment, orientation, supports, and valve location. Investigate pipe vibration and pulsation separately from electrical noise. FlowT's vortex installation guidance can help organize these checks.
Confirm that a liquid meter remains full and that gas or steam service is free of problematic liquid accumulation. Correct installation defects before using calibration changes to compensate for them.
6. Verify Against an Appropriate Reference
Compare readings at minimum, normal, and higher flow using a reference with suitable uncertainty. Record conditions and averaging periods together. A difference smaller than the comparison uncertainty does not establish which instrument is wrong.
Allow both instruments to settle after each change. Align timestamps and compare the same quantity over the same interval, particularly when their damping settings differ. For a tank collection test, include the uncertainty of collected volume and elapsed time. Retain the results so the improvement can be demonstrated after corrective work.
A portable ultrasonic flow meter can support suitable liquid checks, provided its own low-velocity performance and installation are adequate. A standard liquid clamp-on instrument cannot validate steam or gas flow. Follow the flow meter calibration procedure appropriate to the medium.
What Changes for Liquids, Gases, and Steam?
Liquids: check viscosity at the coldest operating condition, pipe filling, and cavitation margin. A viscous liquid can reach the Reynolds-number limit even when its velocity appears reasonable.
Gases: calculate density and actual volume at the meter's pressure and temperature. Verify composition and compressibility assumptions when converting mass or normalized volume. The mass flow versus volume flow guide explains why these quantities need a consistent comparison basis.
Steam: distinguish dry saturated, superheated, and wet conditions. For dry saturated steam, pressure or temperature can establish density through the saturation relationship. Superheated steam requires both. Wet steam needs explicit treatment of condensate and steam quality. Spirax Sarco's steam instrumentation guidance explains these compensation requirements.
Review the compensation configuration of a steam vortex meter alongside its detection limits. Correct density compensation cannot recover missing vortex pulses.
Will a Smaller Measuring Bore Solve the Problem?
Consider an illustrative water flow of 4 m³/h, with density 1,000 kg/m³ and viscosity 0.001 Pa·s. Assume actual internal diameters of 100 and 50 mm, rather than treating nominal sizes as exact dimensions.
Using v = 4Q / (πD²), with Q converted to m³/s:
| Internal diameter | Velocity at 4 m³/h | Reynolds number | Velocity at an assumed 40 m³/h peak |
|---|---|---|---|
| 100 mm | 0.141 m/s | 14,100 | 1.41 m/s |
| 50 mm | 0.566 m/s | 28,300 | 5.66 m/s |
Halving the bore increases velocity fourfold and doubles Reynolds number at the same flow. This improves two relevant conditions, but does not establish compliance with a particular meter's accuracy specification.
Check signal strength, peak velocity, pressure loss, and cavitation using the candidate's sizing calculation. Yokogawa's VY Series specifications include reduced-bore pressure-loss calculations and warn that pressure compensation must account for the pressure drop. Do not assume the smaller instrument is acceptable simply because minimum-flow Reynolds number improves.
In Yokogawa's separate worked gas example, flow is 700 Nm³/h referenced to 0°C and 1 atm. Operating conditions are 1,000 kPa absolute, 30°C, and density 11.5 kg/m³. For a 50 mm connection, calculated losses are 1.4 kPa for the general type, 4.4 kPa with one-size reduction, and 28.2 kPa with two-size reduction. These values apply to that gas example.
At peak duty, compare calculated loss against available pressure and the process allowance. For liquids, check the manufacturer's minimum backpressure requirement as well. FlowT's explanation of the relationship between flow rate and pressure drop provides background, while the candidate meter's calculation supplies the selection values.
Choose Between Adjustment, Resizing, and Replacement
Keep and adjust when minimum flow meets the required accuracy and the investigation identifies a correctable setting or installation issue. Resize when a smaller approved bore covers both endpoints with acceptable pressure loss. Change technology when the required low-flow duty remains outside the vortex meter's supported envelope.
- For conductive liquids, assess an electromagnetic flow meter, including conductivity requirements and low-velocity error terms.
- For suitable clean gases, assess a thermal mass flow meter, checking composition, moisture, and calibration conditions.
- For suitable liquid pipes requiring external installation, assess clamp-on ultrasonic measurement, including low-flow uncertainty and acoustic conditions.
Frequently Asked Questions
Does lowering cutoff improve low-flow accuracy?
It may reveal previously suppressed flow. Accuracy still depends on reliable vortex detection and the specified calibration range. Verify both low flow and no flow afterward.
Is there one minimum flow rate for all vortex meters?
No. Bore, density, viscosity, signal processing, and required accuracy determine the usable lower boundary. Request a result for the actual operating conditions.
Can recalibration fix an oversized meter?
Recalibration cannot create sufficient velocity or a missing vortex signal. Establish the supported measuring range before altering the K-factor.
Specify Performance at Your Lowest Operating Flow
Send FlowT your operating data: fluid, pipe dimensions, minimum/normal/maximum flow, pressure and temperature ranges, output requirements, allowable pressure loss, and required uncertainty. Request a sizing assessment covering all three flow points, with the lower accuracy boundary stated explicitly.


